I’m thrilled to have earned the AZ-900 certification! This achievement reflects my continuous effort and dedication. My past hands-on experience with Azure and exposure in previous job roles made the learning curve smoother and more intuitive. This certification not only validated my cloud knowledge but also motivated me to keep…
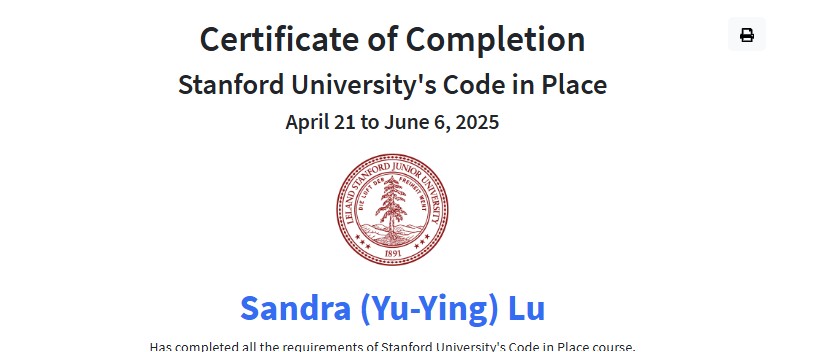
Leveling Up with Python: Code in Place 2025
I’m honored to have completed Stanford University’s Code in Place 2025, where I had the chance to strengthen my Python skills through hands-on learning. Throughout the course, I completed units on Karel the Robot, console programming, graphics, lists, and dictionaries, and successfully submitted a final project. One of the most…
Turning Data Into Stories: Learning the Basics of Visualization
I just finished Basics of Data Visualization Analysis on LinkedIn Learning and found it incredibly insightful. The course emphasized how effective visuals can bring meaning to complex data and help drive better decisions. I especially enjoyed learning about chart types, colour use, and how to avoid misleading visuals. A great…
Building a Strong Foundation: My Introduction to Data Engineering
I recently completed the Data Engineering Foundations course on LinkedIn Learning, and it gave me a solid overview of how data flows through modern systems. From data pipelines to storage solutions, I gained a clearer understanding of how raw data is transformed into valuable insights. It’s a great starting point…
Discovering the Power of Power BI: A Changer for Data Visualization
I learned about Power BI through LinkedIn Learning after hearing colleagues mention it. It truly is a powerful tool that connects to various databases and allows users to quickly create insightful visual reports. I was impressed by how much time it can save in analyzing and presenting data effectively.

